This post is also available in: Italian
Reading Time: 4 minutesMy briefing with Virtual Instruments, during the last Powering the cloud event, was with Skip Bacon (CTO) and Chris James (EMEA Marketing Director).
Virtual Instruments is a company focused in Infrastructure Performance Management for physical, virtual, and cloud computing environments. The VirtualWisdom® platform provides end-to-end visibility into real-time performance, health and utilization metrics from the entire systems stack. Virtual Instruments drives improved performance and availability while lowering the total cost of the infrastructure supporting mission-critical applications.
 Founded in June 2008 through a private equity spin‐out from Finisar Corp, the company headquarter is site at San Jose, in the heart of the Silicon Valley, but they have also an EMEA office in London.
Their CEO (since Apr 2010) John W. Thompson was chairman of the board and CEO of Symantec Corporation and before he has served in a number of senior leadership roles at IBM Corporation.
The market target is the large enterprise and where is needed a real-time performance monitoring, from virtual server to the storage. Typical segment if the financial one. In Italy, actually they haven’t yet any customers, but several world-wide companies that have also offices in Italy.
Their product is designed for customers with business and/or mission critical applications, based on a FC storage, that must be monitored both for the performance and the availability point of view.
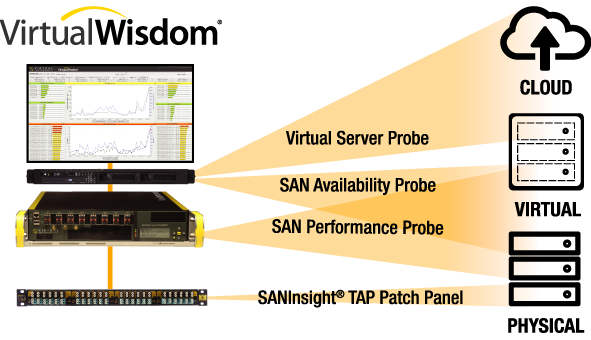
With several probes it can real-time collect (in an agent-less way) several information (with a great detail and a huge frequency) and can correlate all together.
The different probes are:
- Virtual Server Probe: the one that talk with the vCenter Server and can monitor the virtual part. It collects data on and calculates 100+ different metrics including CPU, utilization and status, memory utilization, disk I/O requests and capacity, network requests, and overall utilization, allowing for end-to-end performance analysis from virtual machines to the LUNs.
- SAN Availability Probe: is a software probe that collects status from SAN switches via SNMP. The software probes collect metrics for each port, and these metrics are generated and reported to the VirtualWisdom Server by each SAN Availability Probe.
- SAN Performance Probe: analyzes every frame header on a fibre channel SAN at line rates of up to 8 Gbits per second. The SAN Performance Probe detects application performance slowdowns and transmission errors by measuring every SCSI I/O transaction from start to finish, for every server/volume combination (initiator/ target/ LUN). It is the only true real-time SAN performance monitoring device in the industry and is essential for proactive SAN monitoring so that IT managers can avoid unplanned downtime.
But the most interesting and innovative (and probably unique) part is the The TAP Patch Panel System (TPPS) that provide a passive, fail-safe access point to Fibre-Channel network traffic on a SAN for failure analysis, problem diagnosis, and performance monitoring. TAPs operate “out-of-band” by transparently diverting some of the signal through the TAP to another port, which provides a copy of the Fibre Channel frame headers. The agent-less TAP has no impact on application or SAN performance and is integrated with a Fibre Channel Patch Panel for simple deployment.
Note that you can “split” only the storage FC ports for the storage side, because in this way you can capture all traffic for physical and virtual servers.
Lates press releases:
- Virtual Instruments Opens R&D Center in London’s Tech City
- Virtual Instruments Certifies Corning Cable Systems Pretium EDGE Tap Module to Work with VirtualWisdom Solution
See also: full report list of Powering The Cloud 2012 event.


