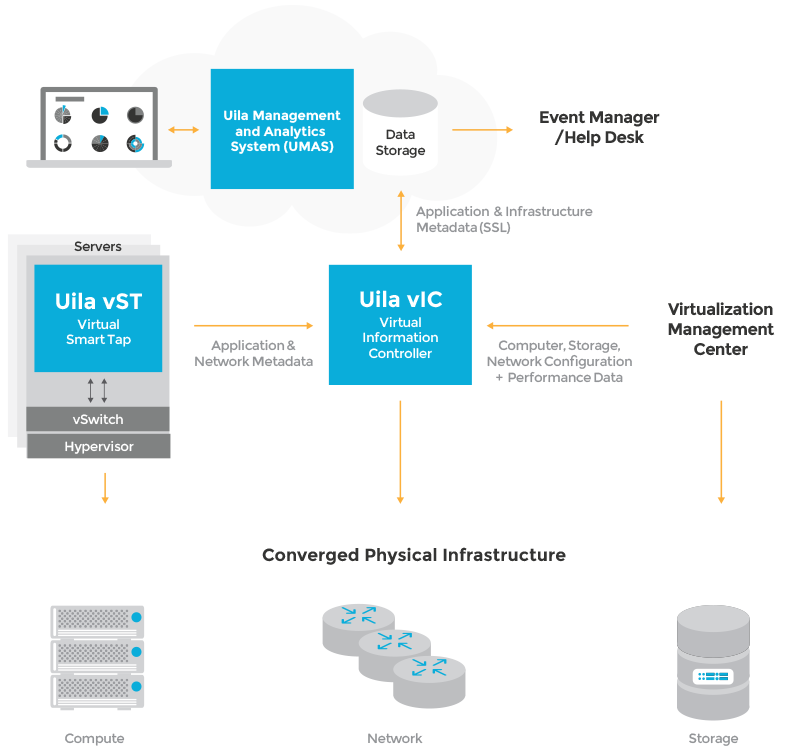
Uila has a very interesting product that provide a holistic full stack monitoring and visualization of an entire infrastructure from the hardware to the applications and services, end-to-end.
Uila provides a non-disruptive and scalable application auto-discovery solution for over 3000 applications and protocols with Deep Packet Inspection (DPI) technology and automatically correlates any application performance issues with underlying network, storage and compute performance to get to root-cause.
So, it’s mainly application-aware and application focused, to ensure real-time visibility into the application and business service dependencies, with with low level details, if needed, for example, for throubleshooting.
The solution it’s a public cloud service but it’s also available as an on-prem service. I’ve already wrote about this company, after the Tech Field Day 13, but some weeks ago I was curious to see if there were some news.
The different parts of the solution are:
- Uila Management and Analytics System (UMAS): the core of Uila virtual infrastructure architecture is a big data store (using Hadoop) and analytics engine that are designed from ground up to scale-out to different needs and size.
- Uila Virtual Information Controller (vIC): is the integration conduit to the data center Virtualization Management System e.g. VMware vCenter. The vIC retrieves your infrastructure configuration as a template to build Uila monitoring domain and to streamline deployment.
- Uila Virtual Smart Tap (vST): measures application response time, network latency, and other network performance data in meta data form.
The first impressive result is how data are visualized, in a “un-convential” way, with nice (and coloured) diagrams. The UI is very interesting, and after few seconds, become also really usable.
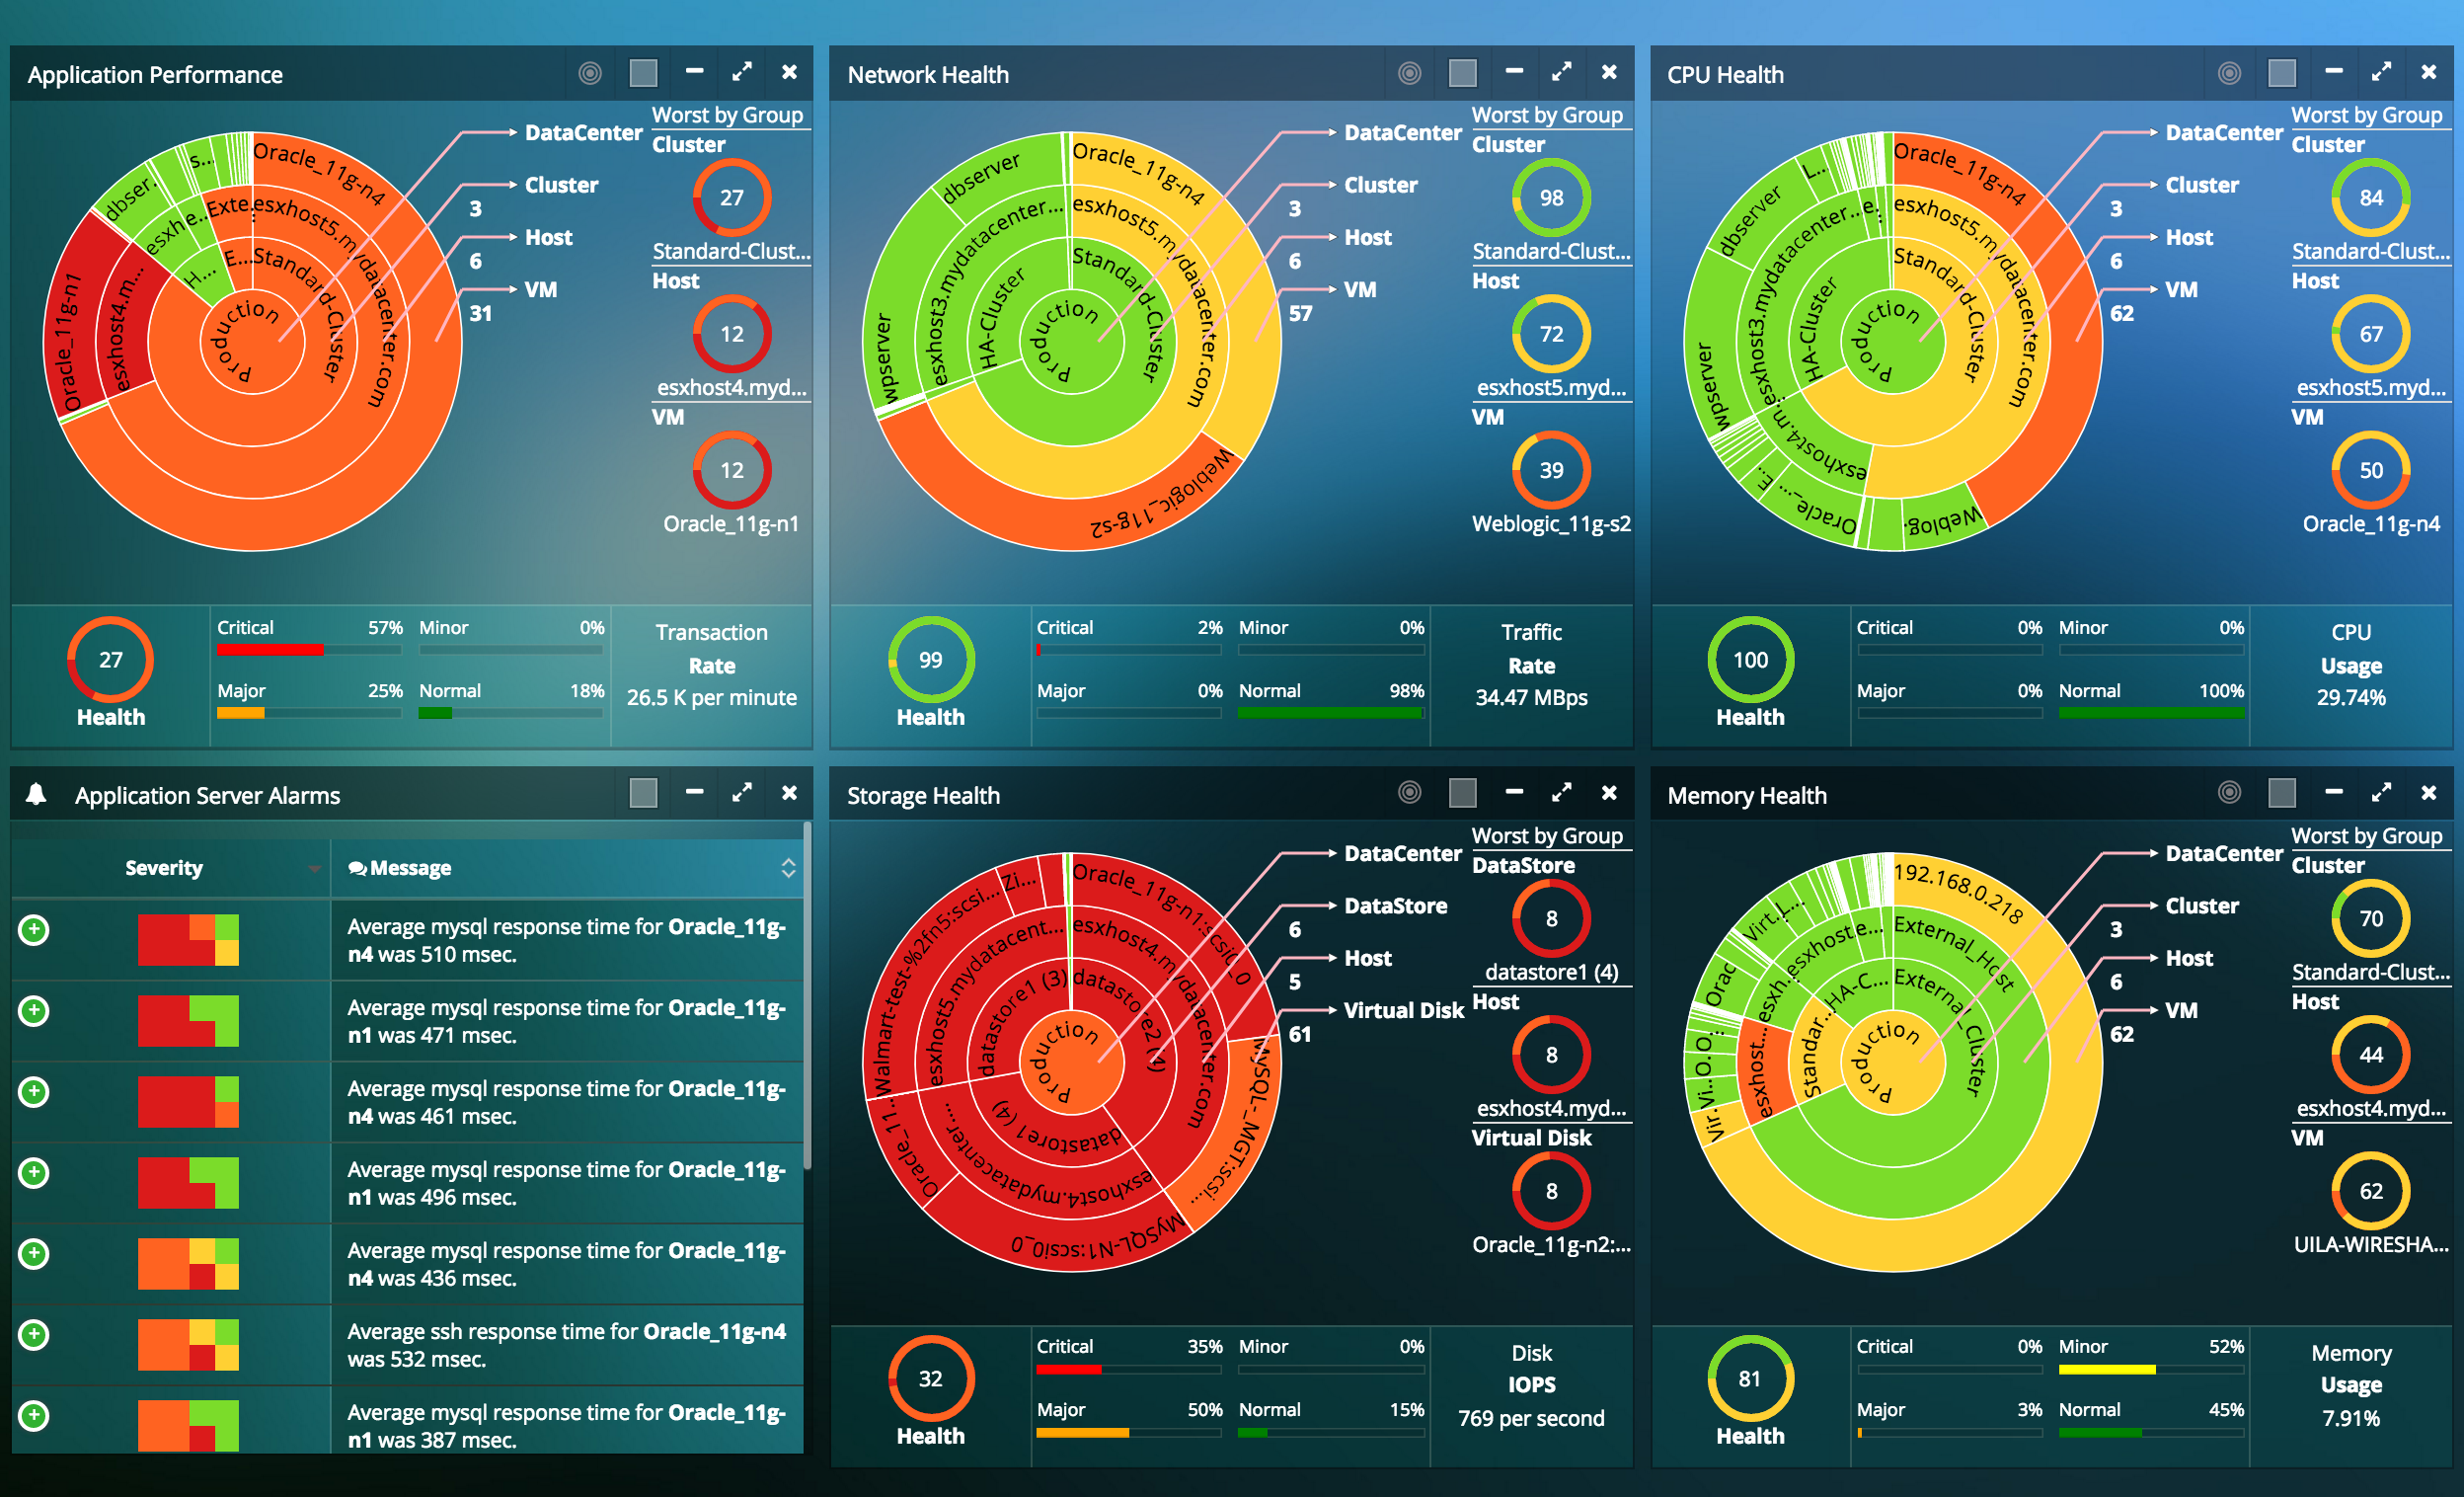
But what it’s most unique, is the holistic full stack monitoring and visibility in a single product that permit to:
- Align business and IT Operations goals in a single product with application visibility and correlated network, compute and storage insights to solve problems before end-user impact.
- Reduce time in War room conversations and instead focus on business acceleration projects.
- Full stack visibility (Application Performance Monitoring, Infrastructure Performance Monitoring, Network Monitoring, Storage Monitoring) for virtualized data centers reduces troubleshooting time from days to minutes, enabling lean IT teams to get time back for more strategic projects
- Identify blind spots in the infrastructure, and eliminate finger pointing between infrastructure and application teams with automated root cause and forensics.
What has been really improved in those years, is the application visibility with some specific vertifical functions.
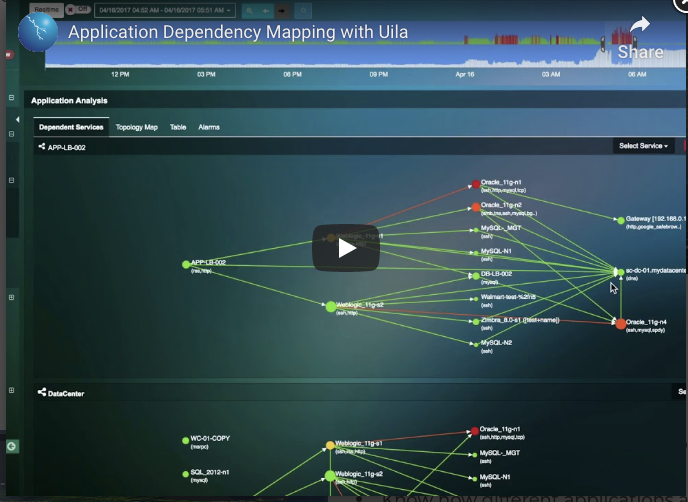
For example the application automatically discover can simplify how document application and server dependencies for different purposes:
-
- Reduced Time to Value with automatic discovery of the topology map for multi-tier applications.
- Troubleshoot issues proactively at lightning speeds with full visibility into the dependencies across applications and infrastructure. View each application service performance by its response time and transaction load on the associated VMs.
- No manual updates or interventions needed to build the Dependency mapping. Install Uila, and we will build the maps automatically.
- Application dependency and topology mapping provides critical insight for defining Migration & Disaster recovery Strategies.
- Overcome poor documentation practices or knowledge transfer of dependencies due to employee turnover.
Another interesting vertical is the automated monitoring of Citrix XenDesktop and VMware Horizon View VDI environment with applicationand VDI components and dependencies discover. In this way is possible monitor applications resources used by the applications/virtual desktop in a single pane of glass.
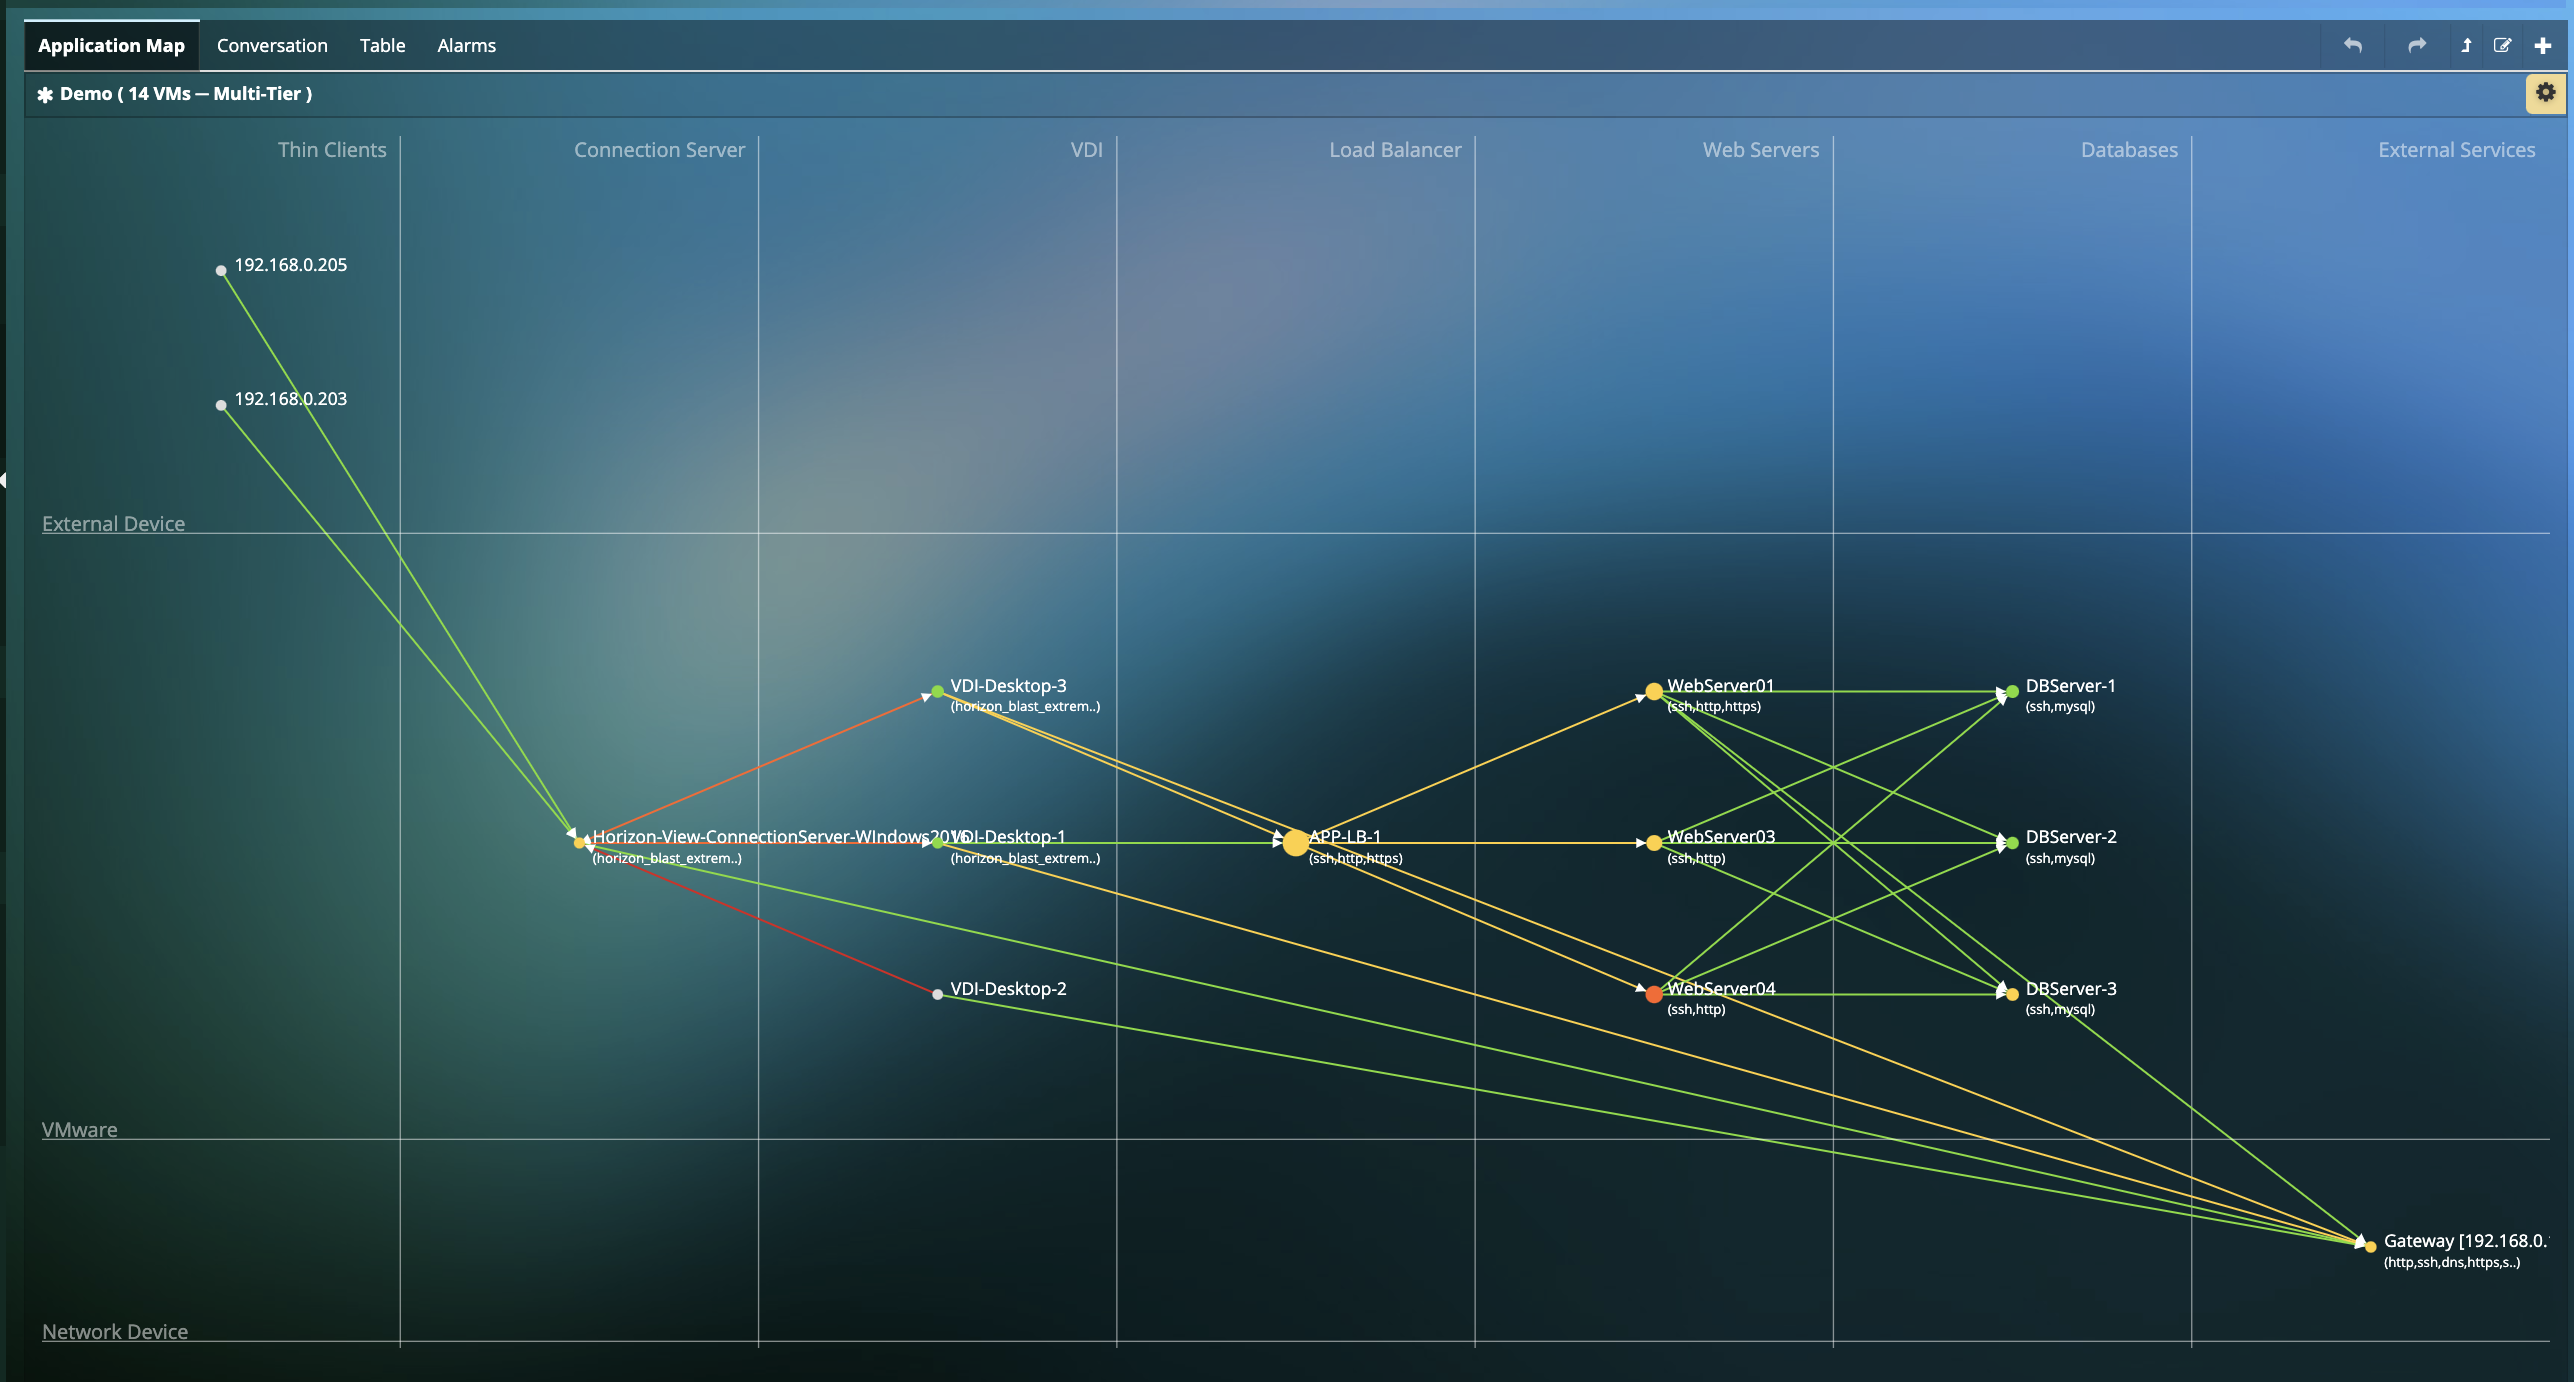
And not only dependencies and discover, but also deep visibility into virtual desktop & network performance in terms of where end users connect from, how many users and applications access your data center and how the WAN bandwidth is used.
Including monitoring the health of the Infrastructure supporting your VDI environment with single-click insight into root cause for VDI issues leading to degraded end-user experience.
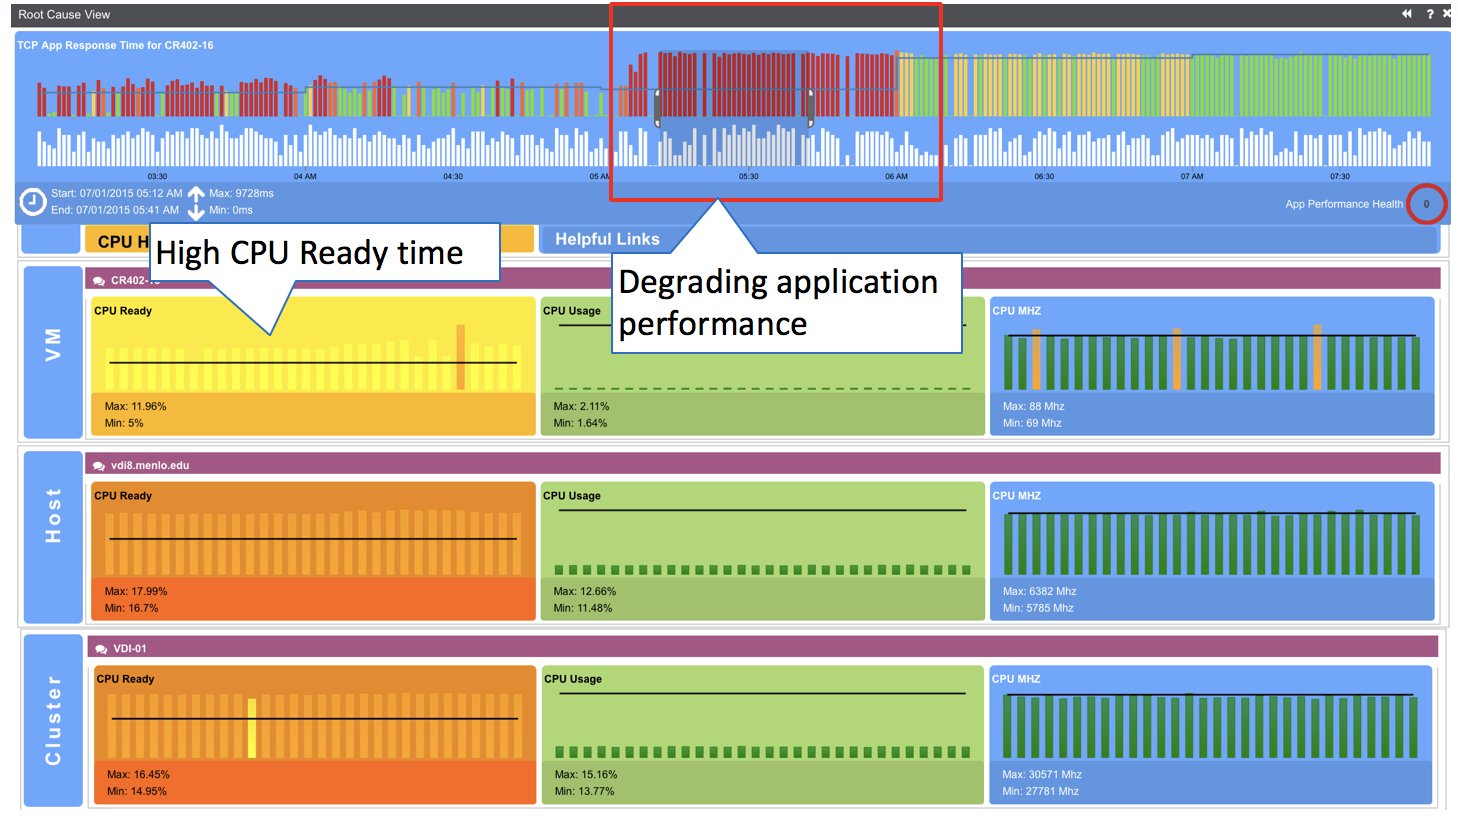
The best way to learn more and understand how powerful it is, it’s just have a tour in the UI using the interactive demo version available on Uila site.

