Reading Time: < 1 minute

Veeam One FreeVeeam ONE is an integrated monitoring and reporting tool for virtual enviroment based on VMware vSphere and/or Microsoft Hyper-V. Also a free edition is available.

In this video, Doug Hazelman, Vice President of Product Strategy at Veeam Software, talks about the new Veeam ONE v6:

For more information:

Reading Time: 3 minutes

With the new version of System Center Virtual Machine Manager (VMM) 2012, the features gap is slowly reduced from the vSphere vCenter Server.

But the positioning and the comparison remain not so simple due to different license (and different cost), different set of features, and different integration with other products.

Note also that some features in Microsoft environment are not depending from VMM but are features of the Hyper-V or the FailOver Cluster part (so are basically included in the free Hyper-V Server), for this reason some features will change when VMM 2012 will be used with the new Hyper-V3 (for more info see Hyper-V 3.0 vs vSphere 5.0).

Another aspect is that VMM partially cover also the vCloud Director features, for example in the Self Provisioning feature or in the Cloud concept (that is similar to the virtual datacenter concept of vCloud).

continue reading…

Reading Time: < 1 minute

One of the new features of System Center VMM 2012 is the ability of manage a supported storage. In a previous post, I’ve described, for example, how manage a Dell storage.

One interesting aspect that I’ve found in a recent event, is that also a Virtual Storage Appliance (VSA) could be managed in the same way. Of course it must export the required interfaces to System Center, and also be supported on Hyper-V (if it runs on this kind of hypervisor).

One the first products that has introduced this functionality was StarWind (that realized basically an iSCSI software target, as introduced in the previous post: Windows Target iSCSI for free). This intent was announced at the beginning of this year.

For more information: StarWind SMI-S and integrations with SCVMM 2012.

Reading Time: < 1 minute

I’ve already written a post about the reintroduction of the MCSA and MCSE certifications. Now that some of them are live (MCSA on Windows Server 2008 was the first, now also the MCSE on Private Cloud is available) the new certification schema has become more clear.

Seems that there on new products only this model will be adopted (so probably no new version of MCTS or MCITP certification) and those MCSE certifications are already be announced:

  • MCSE Private Cloud: already available… Is the new version of the MCITP on virtualization and management.
  • MCSE Server Infrastructure: will be the equivalent of MCITP SA or EA on Windows Server 2012. Exams are actually in beta.
  • MCSE Desktop Infrastructure: little more than the previous MCITP Enterprise Desktop Administrator, now ported on Windows 8 and Windows Server 2012. Exams are actually in beta.
  • MCSE SQL Server 2012: a new certification specific on SQL Server 2012.

Also those MCSA certifications has been announced:

Reading Time: 3 minutes

In previous post we have described the installation of opvizor agent. After this step a configuration is needed in order to start the data collection.

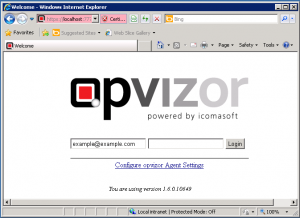
Configuration could be started after the installation phase or simple by open the browser on the local server web (and by choosing the Configure opvizor Agent Settings):

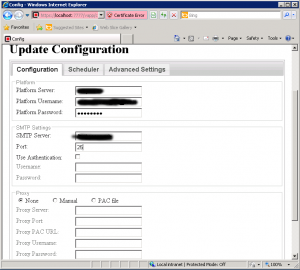
Basically you need to specify the opvizor data (platform server is opvizor.com) included your user account credential. Also you can configure the email and proxy settings:

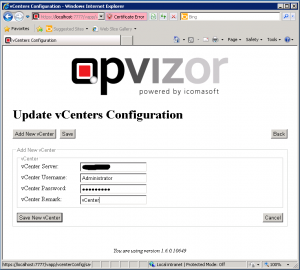
Then you have to specify the vCenter Server configuration and credentials:

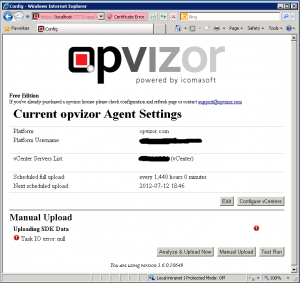
Finally you can review the data and start the first data collection:

Data collection could be started manually or with Analyze & Upload Now (or Test Run) or by manually transfer the data (with Manual Upload button). If all is fine you must see something like this:

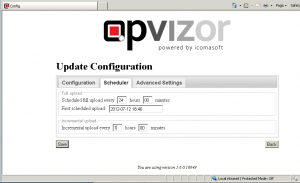
Now you can schedule the frequency of the data upload:

At this point you can start using the tool by simple click on the desktop icon, or by working with the local web server or by simple open and logon in the opvizor.com web site (in all cases you will use this pages).

Note that the opvizor agent will send an email on each manual upload. But also it will generate period report (each week) with a summary of your enviroment and your cases. This is just the first part of the email:

Issues per Upload

Upload Date New Opened Reopened Closed
2012.07.02 12:37:38 123 101 3 1
2012.07.02 11:48:03 0 99 1 3
2012.07.02 10:54:03 12 90 0 1
2012.07.02 10:51:27 8 86 0 2
2012.07.02 10:20:15 0 217 0 0
2012.07.02 10:18:40 217 0 0 0
Reading Time: 3 minutes

In the previous post I’ve introduced what is Opvizor, the architecture and the possible benefit of it. Now let’s see the install procedure.

First you have to register to the main site, then you can download the latest version of the agent (that is just the data collector). Actually is a Windows service… I’ve asked why not a virtual appliance, but this is just a simple service and the VA options was too big (and not so required) compared to the single .EXE file.

Installation is quite simple: just run the Windows Installer and step through it’s wizard. I’ve tried on a Windows Server 2008 R2, but probably can work also on a “client” version of Windows.

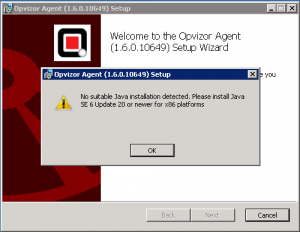
If you use a x64 edition, you must install the 32 version of the Java Virtual Machine. And note that must be version 6, with the latest version 7 does not work:

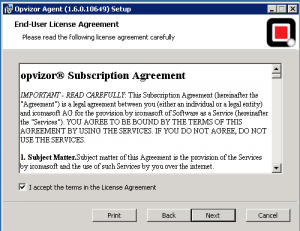
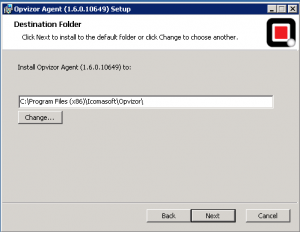
To download the “old” version of the Java run-time use this link. At this point you have to accept the product license and choose the destination folder:

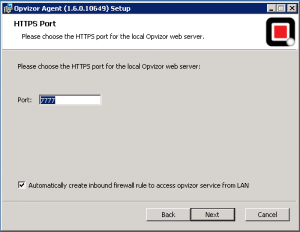
Then specify the local port for the local web server (that is used for the configuration task and also as a “proxy” for the external web site):

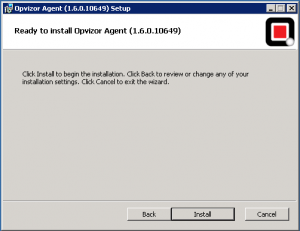
The installation could not begin:

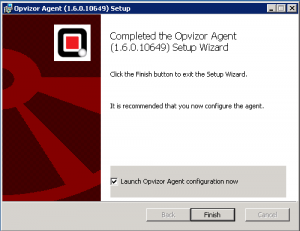
The final step will be the configuration of the “collector”.

Reading Time: 3 minutes

Opvizor is a monitoring tool for virtual environment (actually only vSphere environment) that can be used to analyze and audit the environment in an automated way and to pro-actively solve possible infrastructure bottlenecks and problem areas, before they cause performance degradation or system downtime.

It’s not limited to the monitoring aspect, because it also provide other functions:

  • Analyze: opvizor® ‘s expert system automatically identifies VMware configuration issues within protocol files, performance data and network security.
  • Solve: With 400+ fully integrated, proven best practices, opvizor’s® expert system offers “live” advice to resolve identified and specific problems.
  • Report: opvizor’s® expert system provides administrators with detailed reporting options and documentation.

The interface is web based and is quite clean and simple with a “desktop” approach and traditional icon and monitors. Compared to VMware vCenter Operation Manager, seems a more “traditional” program, more oriented to technical people, but the strengths is that rules could be adapted and also verified.
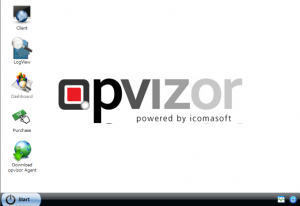
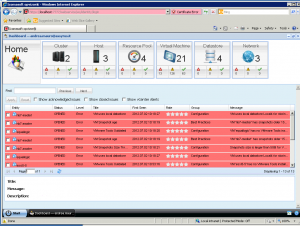
What makes this product interesting is that it is cloud-oriented: it’s composed by two parts, one is on-premise and is a data collector, the second one, with the “engine” and the user interface is on-the-cloud. So we can consider this product one of the first SaaS monitor tool.
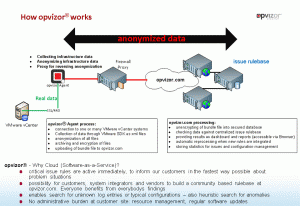
The architecture seems similar to the VMware Capacity Planner tool, and also the security aspects are really close. You can find more detail on them on the opvizor web site, but more are available on the product documentation (especially there is a specific doc with the detail on how and which kind of data are anatomized).

Another interesting aspects is that rules could be modified and adapter, and they are working the community to build new set of rules or simple to validate/improve existing.

Who can be interested on this kind of solution? Most monitoring tools are already simple to install (in some cases are just virtual appliances) and also to configure, but they required resources from your environment. With this solution you can demand this activities to an external service. This aspect could become more interesting when a multi-tenancy interface will be added (I think, for example, for who want to provide management and support as a service, or companies that delegated those tasks to other companies). The price is host based (so no VM limits) and for only two hosts there is also a free (and limited) version.

Interesting also some future plans like the multi-tenancy interface, the support to vCloud Director (actually it works only with vCenter Server) and the monitoring also at application level, with a future set of rules for View and specific applications.

In the next post I will detail the installation and the configuration phases.

© 2025-2011 vInfrastructure Blog | Disclaimer & Copyright