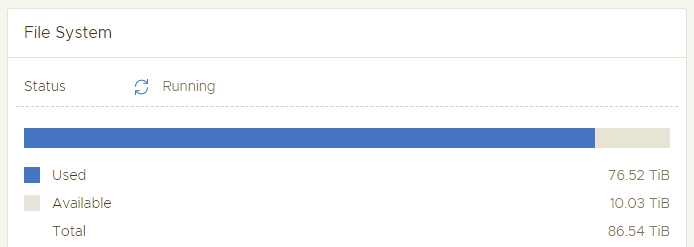
Data Domain (or Power Protect if you prefer the new term) needs some free available space to manage its filesystem and all the mtree(s).
By default there is a critical alert if the used space exeed 90% of the total space.
The name of the alert is “SpaceExceedsCriticalThreshold” and cannot be changed from the GUI.
If space usage has exceeded the configured critical threshold capacity Lack of space, the result can be a loss of file system functionality or missing important logs.
The solution can be free space in the specified tier (for backup, for example by reducing retention) or unit by deleting unneeded items and running cleaning on the tier.
If items cannot be deleted, storage must be added to the appropriate tier to increase the total amount of space.
The DD dashboard will visualize this alert, but also the dashboard is usedful to understad if you are close of not to reach the 90% of utilization:

In order to estimate the trend of usage, a useful graph could be the consumption chart in Data Management / File System / Chart:

But what happens if you delete some data or reduce the retention of your backup jobs?
The free space is not yet available until the cleaning procedure that is done, by default, each week (but you can change the schedule from the GUI).
If still the space is not enough?
There is also a good article that explains different solutions.
Current utilization of the active tier can be displayed via the ‘filesys show space’ or ‘df’ commands:
# filesys show space

Active Tier:
Resource           Size GiB   Used GiB   Avail GiB   Use%   Cleanable GiB*
----------------   --------   --------   ---------   ----   --------------
/data: pre-comp           -   327402.2           -      -                -
/data: post-comp    88621.4    79016.7      9604.7    89%           6823.4 <====
/ddvar                 47.1       14.6        30.1    33%                -
/ddvar/core           108.1        0.1       102.6     0%                -
----------------   --------   --------   ---------   ----   --------------
 * Estimated based on last cleaning of 2022/09/03 17:52:52.
Note that, in this case there is some cleanable space (about 7TB that are almost the 10%!).
If either:
- The value for ‘Cleanable GiB’ is large
- DDFS has become 100% full (and is therefore read only)
Clean should be performed and allowed to run to completion before continuing with any further steps in this document. To start clean the ‘filesys clean start‘ command should be used, i.e.:
# filesys clean startCleaning started. Use ‘filesys clean watch‘ to monitor progress.
To confirm that clean has started as expected the ‘filesys status’ command can be used, i.e.:
Beginning ‘filesys clean’ monitoring. Use Control-C to stop monitoring.
Cleaning: phase 4 of 6 (pre-select)
78.3% complete, 9175 GiB free; time: phase 1:05:00, total 2:33:36
88.8% complete, 9170 GiB free; time: phase 1:13:49, total 2:42:25
95.8% complete, 9168 GiB free; time: phase 1:18:52, total 2:47:28
100.0% complete, 9164 GiB free; time: phase 1:24:55, total 2:53:31
Cleaning: phase 5 of 6 (copy)
20.4% complete, 10136 GiB free; time: phase 2:31:15, total 5:24:48
29.1% complete, 10402 GiB free; time: phase 2:55:15, total 5:48:48
Cleaning: phase 6 of 6 (summary)
15.1% complete, 10492 GiB free; time: phase 0:19:11, total 6:52:43
35.2% complete, 10490 GiB free; time: phase 0:45:08, total 7:18:40
49.0% complete, 10489 GiB free; time: phase 1:03:13, total 7:36:45
76.6% complete, 10489 GiB free; time: phase 1:37:42, total 8:11:14
96.2% complete, 10488 GiB free; time: phase 2:02:17, total 8:35:49
100.0% complete, 10488 GiB free; time: phase 2:06:16, total 8:39:48
Note that this command will take a looot of time… the phase 5 will be several hours long!
At the end the df command will show less cleanable space:
Active Tier:
Resource Size GiB Used GiB Avail GiB Use% Cleanable GiB*
---------------- -------- -------- --------- ---- --------------
/data: pre-comp - 326716.9 - - -
/data: post-comp 88621.4 78134.2 10487.2 88% 263.2
/ddvar 47.1 14.7 30.0 33% -
/ddvar/core 108.1 0.1 102.6 0% -
---------------- -------- -------- --------- ---- --------------


